Page 24 - BES2016_ING
P. 24

Individual Pension System 2016 Progress Report

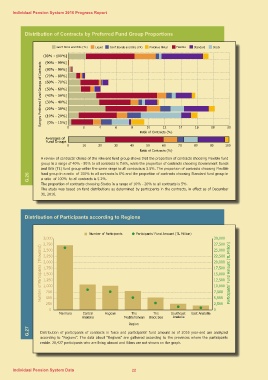
Distribution of Contracts by Preferred Fund Group Proportions

                                                        Gov't Bons and Bills (TL)    Liquid  Gov't Bonds and Bills (FX)  Precious Metal  Flexible      Standard  Stock

      Ranges Preferred Fund Groups of Contracts  (99% - 100%]              2 4 6 8 10 12 14 16 18 20
                                                  (90% - 99%]                                                                     Ratio of Contracts (%)
                                                  (80% - 90%]
                                                  (70% - 80%]              10 20 30 40 50 60 70 80 90 100
                                                  (60% - 70%]                                                                     Ratio of Contracts (%)
                                                  (50% - 60%]
                                                  (40% - 50%]
                                                  (30% - 40%]
                                                  (20% - 30%]
                                                  (10% - 20%]
                                                    (0% - 10%]
                                                                        0

                                                  Averages of
                                                  Fund Groups

                                                                        0

G.26  A review of contracts’ choice of the relevant fund group shows that the proportion of contracts choosing Flexible fund
      group in a range of 40% - 50% to all contracts is 7.6%, while the proportion of contracts choosing Government Bonds
      and Bills (TL) fund group within the same range to all contracts is 3.5%. The proportion of contracts choosing Flexible
      fund group in a ratio of 100% to all contracts is 6% and the proportion of contracts choosing Standard fund group in
      a ratio of 100% to all contracts is 5.2%.
      The proportion of contracts choosing Stocks in a range of 10% - 20% to all contracts is 5%.
      The study was based on fund distributions as determined by participants in the contracts, in effect as of December
      31, 2016.

Distribution of Participants according to Regions

                                                                                   Number of Participants      Participants' Fund Amount (TL Million)

                                                 3,000                                                                                                           30,000
                                                 2,750
      Number of Participants (Thousand)          2,500                                                                                                           27,500     Participants' Fund Amount (TL Million)
                                                 2,250
                                                 2,000                                                                                                           25,000
                                                 1,750
                                                 1,500                                                                                                           22,500
                                                 1,250
                                                 1,000                                                                                                           20,000

                                                   750                                                                                                           17,500
                                                   500
                                                   250                                                                                                           15,000

                                                     0                                                                                                           12,500

                                                                                                                                                                 10,000

                                                                                                                                                                 7,500

                                                                                                                                                                 5,000

                                                                                                                                                                 2,500

                                                        Marmara            Central           Aegean              The The                 Southeast                       0
                                                                           Anatolia                        Mediterranean Black Sea        Anatolia     East Anatolia

                                                                                                           Region

G.27  Distribution of participants of contracts in force and participants’ fund amount as of 2016 year-end are analyzed
      according to “Regions”. The data about “Regions” are gathered according to the provinces where the participants
      reside. 28,427 participants who are living abroad and Kıbrıs are not shown on the graph.

Individual Pension System Data                                                                             22
   19   20   21   22   23   24   25   26   27   28   29