
Page 22 - BES2016_ING
P. 22
Individual Pension System 2016 Progress Report
1.3 Participants
Accumulations of Participants according to Gender and Ages
Female Age Male
1,200 1,000 800 600 400 200 75 200 400 600 800 1,000 1,200
74
73
72
71
70
69
68
67
66
65
64
63
62
61
60
59
58
57
56
55
54
53
52
51
50
49
48
47
46
45
44
43
42
41
40
39
38
37
36
35
34
33
32
31
30
29
28
27
26
25
24
23
22
21
20
19
18
0
Participants' Fund Amount (TL Million)
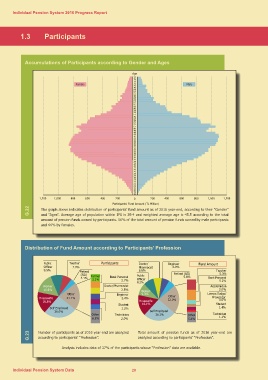
G.22 The graph above indicates distribution of participants’ fund amount as of 2016 year-end, according to their “Gender”
and “Ages”. Average age of population within IPS is 39.4 and weighted average age is 45.5 according to the total
amount of pension funds owned by participants. 56% of the total amount of pension funds owned by male participants
and 44% by females.
Distribution of Fund Amount according to Participants’ Profession
Public Teacher Participants Doctor/ Engineer Fund Amount
Pharmacist 6.0%
Officer 7.0% 6.6% Teacher
9.5% Retired (SSI) 5.3%
Retired Public 5.6%
Officer Bank Personel
(SSI) Farmer Bank Personel 8.2% 5.2%
4.1% 3.1% 2.7%
Academician
Worker Other Doctor/Pharmacist Worker Other 2.0%
15.6% 21.1% 2.5% 9.3% 22.0%
Lawyer/Judge/
Housewife Engineer Housewife Prosecutor
16.6% 2.4% 16.1% 1.6%
Student
Self Employed Student Self Employed 1.4%
26.0% 2.2% 26.1%
Technician
Other Technician Other 1.1%
6.2% 2.0% 5.4%
G.23 Number of participants as of 2016 year-end are analyzed Total amount of pension funds as of 2016 year-end are
according to participants’ “Profession”. analyzed according to participants’ “Profession”.
Analysis includes data of 37% of the participants whose “Profession” data are available.
Individual Pension System Data 20