
Page 79 - BES2016_ING
P. 79
Individual Pension System 2016 Progress Report
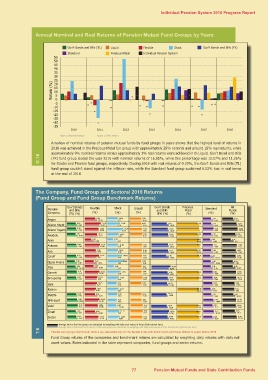
Annual Nominal and Real Returns of Pension Mutual Fund Groups by Years
Gov't Bonds and Bills (TL) Liquid Flexible Stock Gov't Bonds and Bills (FX)
Standard Precious Metal Individual Pension System
Return (%) 55
50
45 2011 2012 2013 2014 2015 2016
40
35
30
25
20
15
10
5
0
-5
-10
-15
-20
-25
-30
-35
2010
Bars = Nominal return Spots = Real return
G.18 A review of nominal returns of pension mutual funds by fund groups in years shows that the highest level of returns in
2016 was achieved in the Precious Metal fun group with approximately 29% nominal and around 19% real returns, while
approximately 9% nominal returns versus approximately 1% real returns were achieved in th Liquid. Gov’t Bond and Bills
(FX) fund group closed the year 2016 with nominal returns of 16.95%, while this percentage was 12.07% and 11.26%
for Stocks and Flexible fund groups, respectively. Closing 2016 with real returns of 0.20%, the Gov’t Bonds and Bills (TL)
fund group couldn’t stand against the inflation rate, while the Standard fund group sustained 0.03% loss in real terms
at the end of 2016.
The Company, Fund Group and Sectoral 2016 Returns
(Fund Group and Fund Group Benchmark Returns)
Pension Gov't Bonds Flexible Stock Liquid Gov't Bonds Precious Standard All
Company and Bills (%) (%) and Bills Metal (%) Funds
(%) (FX) (%) (%) (%)
(TL) (%) 8.83 8.76 7.57
10.32 10.40 9.43 16.15 27.79 9.53 8.55
Aegon 8.02 9.22 18.15 9.72
Allianz Hayat 9.63 13.36 8.68 27.84 7.71
Allianz Yaşam 12.24 12.66 9.53 17.20 29.93 9.76 11.37
Anadolu 8.16 9.18 18.20 29.20 11.95
Asya 9.50 11.57 9.57 29.91 9.79
Avivasa 11.75 15.89 9.61 17.25 27.26 9.62 12.02
Axa 7.67 13.23 9.65 17.90 29.38 12.30
Cardif 9.98 10.27 9.47 29.76 7.62
Cigna Finans 10.77 11.34 17.26 9.50 10.25
Fiba 8.44 9.97 9.81 18.11 29.32 11.32
Garanti 9.48 5.37 9.51 17.27 29.70 6.85
Groupama 8.08 5.77 18.19 8.44 6.74
8.23 9.31 9.40 15.40 29.36 9.17
Halk 9.49 12.71 9.47 18.15 29.21 9.11
Katılım 11.88 11.06 9.66 11.45
Metlife 7.29 9.19 9.61 20.09 29.31 11.57
NN Hayat 9.38 9.28 9.59 18.00 27.54 7.62
Vakıf 9.79 10.65 16.81 29.67 9.53 10.67
Ziraat 7.86 9.49 8.74 18.21 29.18 11.47
Sector 10.13 11.95 9.41 17.15 6.73
9.92 14.64 9.17 18.14 10.31 10.56
9.11 9.19 9.50 16.31 11.00
9.70 7.62 17.56 7.39
10.14 17.08 9.04 10.66 8.44
8.24 9.23 9.57 15.57 9.59
9.47 7.26 16.85 7.31
10.64 6.39 9.78 9.16 8.40
8.56 9.19 9.51 16.24 10.53
9.45 12.31 17.10 8.82
9.20 11.10 13.47 8.73 9.89 10.96
10.55 9.45 9.42 18.56 10.91
10.24 17.86 8.90
9.76 9,84 11.38 8.72 16.95 9.66 10.74
9.77 9.19 9.37 18.05 11.19
10,25 8.47
7.85 9.23 9.22 8.83 9.49 9.58
9.47 9.18 9.47 10.05
9.53 6.86
8.31 8.48 11.17 9.77 8.47 9.31
9.67 9.26 9.47 9.62
8.61 7.47
10.71 9.52 9.81 9.46 8.61
9.18 9.52 10.24
12.40 9.24
11.35 9.07 9.42 10.64 10.70
9.18 9.52 10.74
10.81 8.52
11.05 8.87 9.75 10.47
10.75 11.13
8.29 9.71
10.25 11.71 10.30 9.63
9.21 10.51
11.22 8.50
11.13 12.07 9.70 10.77
10.01 11.24
T.6 Average returns the fund groups are calculated by weighting with daily asset values of funds (Dark-colored bars)
Average returns the benchmark returns of the fund groups are calculated by weighting with daily asset values of their bechmarks (Light-colored bars)
Flexible fund groups’ benchmark returns are calculated only for the flexible funds with benchmarks and those offered to public before 2016.
Fund Group returns of the companies and benchmark returns are calculated by weighting daily returns with daily net
asset values. Rates indicated in the table represent companies, fund groups and sector returns.
77 Pension Mutual Funds and State Contribution Funds