
Page 17 - BES2016_ING
P. 17
Individual Pension System 2016 Progress Report
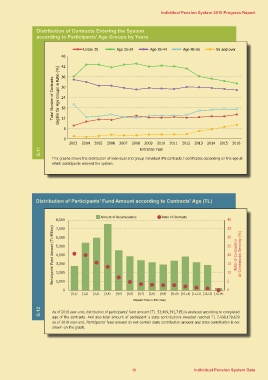
Distribution of Contracts Entering the System
according to Participants’ Age Groups by Years
Under 25 Age 25-34 Age 35-44 Age 45-55 56 and over
48
Total Number of Contracts 42
Eligible for Age Groups in Ratio (%)
36
30
24
18
12
6
0 2004 2005 2006 2007 2008 2009 2010 2011 2012 2013 2014 2015 2016
2003 Entrance Year
G.11
This graphs shows the distribution of individual and group individual IPS contracts / certificates depending on the age at
which participants entered the system.
Distribution of Participants’ Fund Amount according to Contracts’ Age (TL)
8,000 Amount of Accumulations Ratio of Contracts 40
7,000
Participants' Fund Amount (TL Million) 6,000 35
5,000
4,000 30 Ratio of Contracts in
3,000 All Contracts by Seniority (%)
2,000 25
1,000
20
0
15
10
5
[0,1) [1,2) [2,3) [3,4) [4,5) [5,6) [6,7) [7,8) 0
[8,9) [9,10) [10,11) [11,12) [12,13) [13,14)
Elapsed Time in IPS (Year)
G.12 As of 2016 year-end, distribution of participants’ fund amount (TL 53,409,391,715) is analyzed according to completed
age of the contracts. And also total amount of participant´s state contributions invested reached TL 7,438,179,620
as of 2016 year-end. Participants’ fund amount do not contain state contribution amount and state contribution is not
shown on the graph.
15 Individual Pension System Data