
Page 18 - BES2016_ING
P. 18
Individual Pension System 2016 Progress Report
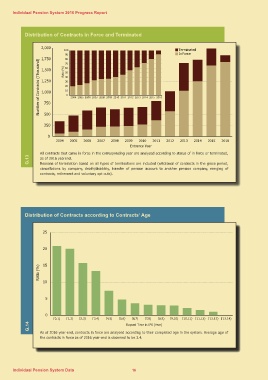
Distribution of Contracts in Force and Terminated
2,000 100 Terminated
1,750 90 InForce
1,500 80
Number of Contracts (Thousand) 1,250 70
1,000 60
Ratio (%) 50
750 40
30
20
10
0
2004 2005 2006 2007 2008 2009 2010 2011 2012 2013 2014 2015 2016
500
250
G.13 0
2004 2005 2006 2007 2008 2009 2010 2011 2012 2013 2014 2015 2016
Entrance Year
All contracts that came in force in the corresponding year are analyzed according to status of in force or terminated,
as of 2016 yearend.
Reasons of termination based on all types of terminations are included (witdrawal of contracts in the grace period,
cancellations by company, death/disability, transfer of pension account to another pension company, merging of
contracts, retirement and voluntary opt outs).
Distribution of Contracts according to Contracts’ Age
25
20
Ratio (%) 15
10
5
0 [1,2) [2,3) [3,4) [4,5) [5,6) [6,7) [7,8) [8,9) [9,10) [10,11) [11,12) [12,13) [13,14)
Elapsed Time in IPS (Year)
[0,1)
G.14 As of 2016 year-end, contracts in force are analyzed according to their completed age in the system. Average age of
the contracts in force as of 2016 year-end is observed to be 3.4.
Individual Pension System Data 16