
Page 58 - BES2016_ING
P. 58
Individual Pension System 2016 Progress Report
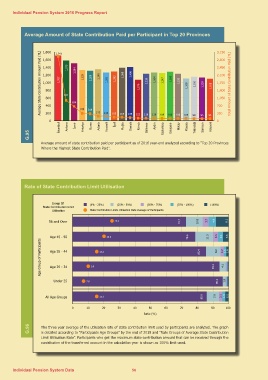
Average Amount of State Contribution Paid per Participant in Top 20 Provinces
Avarage State Contribution Amount Paid (TL) 1,800 2,945 3,150 Total Amount of State Contribution Paid (TL)
1,600 2,800
1,400 1,707 2,450
1,575
1,200 2,100
1,504
1,000 1,329 1,750
1,309
800 1,348
600 1,261
400 1,292
200
1,388
0 1,406
1,076
1,228
1,264
1,247
1,283
1,230
1,108
1,150
1,139
1,100
1,400
931
1,050
654
700
338 319
213 213 165 165 135 121 116 116 109 106 106 105 98 95 91 350
0
İstanbul
G.95 Ankara
İzmir
Antalya
Bursa
Adana
Kocaeli
İçel
Muğla
Denizli
Konya
Balıkesir
Aydın
Gaziantep
Eskişehir
Hatay
Manisa
Tekirdağ
Samsun
Kayseri
Average amount of state contribution paid per participant as of 2016 year-end analyzed according to “Top 20 Provinces
Where the Highest State Contribution Paid”.
Rate of State Contribution Limit Utilisation
Group Of (0% - 25%] (25% - 50%] (50% - 75%] (75% - 100%) [100%]
State Contribution Limit
State Contribution Limits Utilisation Rate Average of Participants
Utilisation
25.3 72.7
56 and Over 10.8
3.7
4.8
8.1
Age Group of Participants Age 45 - 55 20.0 78.6 11.3
Age 35 - 44 15.3 9.2 3.3
85.4 2.2 3.1
1.5
1.6 3.6
Age 25 - 34 9.9 94.1
Under 25 7.0 96.2
1.9 4.1
All Age Groups 15.3 85.9
7.9
2.1
1.9
2.2
0 10 20 30 40 50 60 70 80 90 100
Ratio (%)
G.96 The three year average of the utilisation rate of state contribution limit used by participants are analyzed. The graph
is detailed according to “Participants Age Groups” by the end of 2015 and “Rate Groups of Average State Contribution
Limit Utilisation Rate”. Participants who get the maximum state contribution amount that can be received through the
contribution of the transferred account in the calculation year is shown as 100% limit used.
Individual Pension System Data 56