
Page 57 - BES2016_ING
P. 57
Individual Pension System 2016 Progress Report
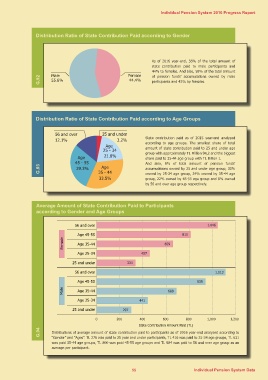
Distribution Ratio of State Contribution Paid according to Gender
G.92 Male Female As of 2016 year-end, 56% of the total amount of
55.6% 44.4% state contribution paid to male participants and
44% to females. And also, 58% of the total amount
of pension funds’ accumulations owned by male
participants and 42% by females.
Distribution Ratio of State Contribution Paid according to Age Groups
G.93 56 and over 25 and under State contribution paid as of 2015 year-end analyzed
12.1% 3.2% according to age groups. The smallest share of total
amount of state contribution paid to 25 and under age
Age Age group with approximately TL Million 94,2 and the biggest
45 - 55 25 - 34 share paid to 35-44 age group with TL Billion 1.
29.3% 21.8% And also, 6% of total amount of pension funds’
accumulations owned by 25 and under age group, 30%
Age owned by 25-34 age group, 34% owned by 35-44 age
35 - 44 group, 22% owned by 45-55 age group and 8% owned
33.5% by 56 and over age group respectively.
Average Amount of State Contribution Paid to Participants
according to Gender and Age Groups
56 and over 1.046
Age 45-55 811
Female Age 35-44 659
Age 25-34 457
25 and under 334
56 and over 1.113
Age 45-55 939
G.94 Age 35-44 688
Male Age 25-34 441
25 and under 297
0 200 400 600 800 1,000 1,200
State Contribution Amount Paid (TL)
Distributions of average amount of state contribution paid to participants as of 2016 year-end analyzed according to
“Gender” and “Ages”. TL 276 was paid to 25 year and under participants, TL 416 was paid to 25-34 age groups, TL 631
was paid 35-44 age groups, TL 800 was paid 45-55 age groups and TL 984 was paid to 56 and over age group as an
average per participant.
55 Individual Pension System Data