
Page 67 - BES2016_ING
P. 67
Individual Pension System 2016 Progress Report
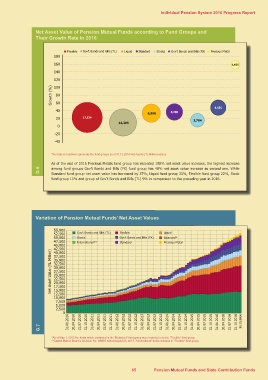
Net Asset Value of Pension Mutual Funds according to Fund Groups and
Their Growth Rate in 2016
Flexible Gov't Bonds and Bills (TL) Liquid Standard Stocks Gov't Bonds and Bills (FX) Precious Metal
180 1,425
160
Growth (%) 140
120
100 4,565
80
60 6,566 5,298
40
20 17,524
0 14,205 3,704
-20
-40
G.6 The data on bubbles represents the fund groups as of 31.12.2016 Net Assets (TL Million) values.
As of the end of 2016 Precious Metals fund group has recorded 158% net asset value increase, the highest increase
among fund groups Gov’t Bonds and Bills (FX) fund group has 48% net asset value increase as second one. While
Standard fund group net asset value has increased by 37%, Liquid fund group 33%, Flexible fund group 22%, Stock
fund group 15% and group of Gov’t Bonds and Bills (TL) 9% in comparison to the preceding year in 2016.
Variation of Pension Mutual Funds’ Net Asset Values
55,000 Gov't Bonds and Bills (TL) Flexible Liquid
52,500 Stocks Gov't Bonds and Bills (FX) Balanced*
50,000 International** Standard Precious Metal
47,500
Net Asset Value (TL Million) 45,000
42,500
40,000
37,500
35,000
32,500
30,000
27,500
25,000
22,500
20,000
17,500
15,000
12,500
10,000
7,500
5,000
2,500
0
G.7
31.01.2010
30.04.2010
31.07.2010
31.10.2010
31.01.2011
30.04.2011
31.07.2011
31.10.2011
31.01.2012
30.04.2012
31.07.2012
31.10.2012
31.01.2013
30.04.2013
31.07.2013
31.10.2013
31.01.2014
30.04.2014
31.07.2014
31.10.2014
31.01.2015
30.04.2015
31.07.2015
31.10.2015
31.01.2016
30.04.2016
31.07.2016
31.10.2016
31.12.2016
*As of May 1. 2013 the funds which contained in the “Balanced” fund group were included in to the “Flexible” fund group.
**Capital Market Board’s Decision No. 29/955 dated August 23, 2013, “International” funds included in “Flexible” fund group.
65 Pension Mutual Funds and State Contribution Funds