
Page 68 - BES2016_ING
P. 68
Individual Pension System 2016 Progress Report
2.3 Asset Allocation of Fund Groups
Portfolio allocations are calculated through funds daily net asset values. The funds offered to public in 2016 are included in the
calculations, State Contribution fund group is excluded from the calculation of averages.
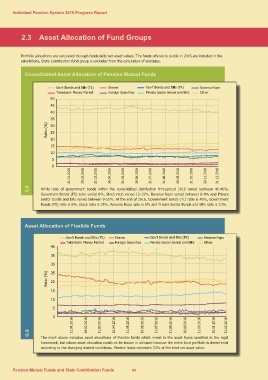
Consolidated Asset Allocation of Pension Mutual Funds
Gov't Bonds and Bills (TL) Shares Gov't Bonds and Bills (FX) Reverse Repo
Takasbank Money Market Foreign Securities Private Sector Bonds and Bills Other
50
Ratio (%) 45
40
35
30
25
20
15
10
5
0
G.8
31.01.2016
29.02.2016
31.03.2016
30.04.2016
31.05.2016
30.06.2016
31.07.2016
31.08.2016
30.09.2016
31.10.2016
30.11.2016
31.12.2016
While ratio of government bonds within the consolidated distribution throughout 2016 varied between 40-46%,
Goverment Bonds (FX) ratio varied 8%, Stock ratio varied 12-15%, Reverse Repo varied between 6-9% and Private
Sector bonds and bills varied between 9-11%. At the end of 2016, Government Bonds (TL) ratio is 40%, Government
Bonds (FX) ratio is 8%, Stock ratio is 15%, Reverse Repo ratio is 8% and Private Sector Bonds and Bills ratio is 10%.
Asset Allocation of Flexible Funds Shares Gov't Bonds and Bills (FX) Reverse Repo
Foreign Securities Private Sector Bonds and Bills Other
Gov't Bonds and Bills (TL)
Ratio (%) Takasbank Money Market
40
35
30
25
20
15
10
5
0
G.9
31.01.2016
29.02.2016
31.03.2016
30.04.2016
31.05.2016
30.06.2016
31.07.2016
31.08.2016
30.09.2016
31.10.2016
30.11.2016
31.12.2016
The chart above indicates asset allocations of Flexible funds which invest in the asset types specified in the legal
framework, but whose asset allocation could not be known in advance because the entire fund portfolio is determined
according to the changing market conditions. Flexible funds represent 33% of the total net asset value.
Pension Mutual Funds and State Contribution Funds 66