
Page 70 - BES2016_ING
P. 70
Individual Pension System 2016 Progress Report
2.4 Total Net Asset Values and Average Returns of Fund Groups
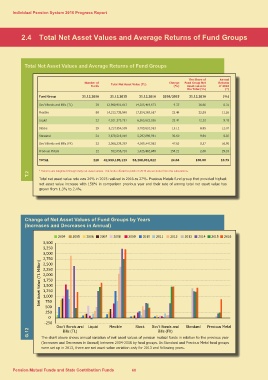
Total Net Asset Values and Average Returns of Fund Groups
Number of Total Net Asset Value (TL) Change The Share of Annual
Funds (%) Fund Group Net Returns
of 2016
31.12.2016 Asset value in
29 the Total (%) (*)
88 (%)
Fund Group 23 31.12.2015 31.12.2016 2016/2015 31.12.2016
Gov’t Bonds and Bills (TL) 29 12,988,901,813 14,205,419,673 8.31
Flexible 24 14,312,739,948 17,524,369,617 9.37 26.66
Liquid 23 11.26
Stocks 12 4,921,273,721 6,565,622,056 22.44 32.89
Standard 3,217,354,509 3,703,810,913 9.42
Gov’t Bonds and Bills (FX) 3,878,519,049 5,297,899,591 33.41 12.32
Precious Metals 3,088,339,367 4,565,447,083 12.07
1,425,462,888 15.12 6.95
TOTAL 552,056,716 8.50
36.60 9.94
16.95
47.83 8.57
158.21 2.68 29.18
228 42,959,185,123 53,288,031,822 24.04 100.00 10.79
G.12 T.2 * Returns are weighted through daily net asset values. The funds offered to public in 2016 are excluded from the calculations.
Net Asset Value (TL Million)Total net asset value rate was 24% in 2015 realized in 2016 as 27%. Precious Metals fund group that provided highest
net asset value increase with 158% in comparison previous year and their rate of among total net asset value has
grown from 1.3% to 2.4%.
Change of Net Asset Values of Fund Groups by Years
(Increases and Decreases in Annual)
2004 2005 2006 2007 2008 2009 2010 2011 2012 2013 2014 2015 2016
3,500 Gov't Bonds and Liquid Flexible Stock Gov't Bonds and Standard Precious Metal
3,250 Bills (TL) Bills (FX)
3,000
2,750
2,500
2,250
2,000
1,750
1,500
1,250
1,000
750
500
250
0
-250
The chart above shows annual variation of net asset values of pension mutual funds in relation to the previous year
(Increases and Decreases in Annual) between 2004-2016 by fund groups. As Standard and Precious Metal fund groups
were set up in 2013, there are net asset value variation only for 2013 and following years.
Pension Mutual Funds and State Contribution Funds 68